VS Code Integration
The Julia VS Code extension provides rich support for the test item framework. It continuously discovers @testitems in your project and displays them in the editor.
Discovering Test Items
When you open a Julia package in VS Code, the extension scans all .jl files for @testitem blocks. Detected test items appear in:
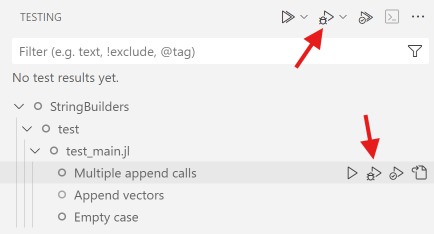
- The Testing activity bar — a tree view of all test items in your project
- Inline run buttons — small play icons next to each
@testitemin the editor
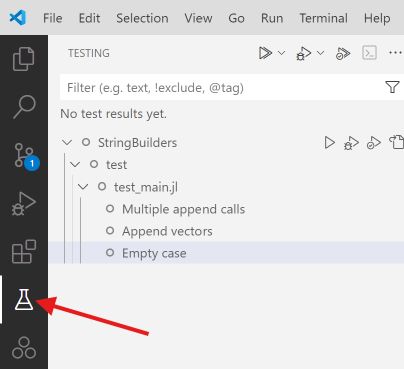
Discovery is live — test items update after every keypress as you edit your code.
Running Tests
You can run test items from multiple places in the VS Code UI:
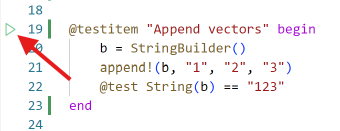
- Click the play button next to a
@testitemin the editor - Use the Testing activity bar to run individual items, files, or all tests
- Right-click a test item for additional options (Run, Debug, Coverage)
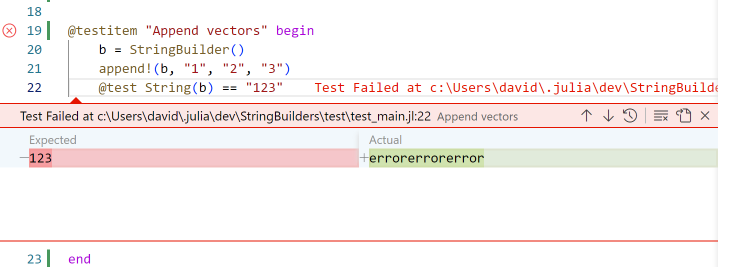
Test results appear inline in the editor. When a test fails, the extension shows the failure details directly at the line where the @test failed — no scrolling through REPL output.
Parallel Execution
By default, VS Code runs test items in a single Julia process. To enable parallel execution, change the number of test processes in settings:
Setting: Julia: Num Test Processes
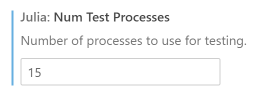
1(default) — serial execution0— use as many processes as CPU cores- Any positive number — use that many processes
More processes means faster test runs but higher memory usage. There is also startup overhead for each new process.
Managing Test Processes
Test processes launched by the extension persist between runs for fast re-execution. They appear in the Julia Workspace panel alongside REPL and Notebook processes.
To free resources, terminate test processes via the Stop Test Process button in the Julia Workspace panel.
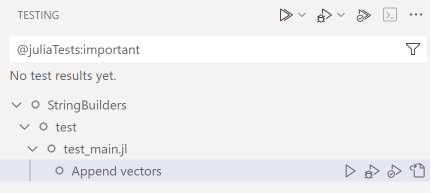
Filtering by Tags
If your test items have tags, you can filter the test list in the VS Code Testing panel to show only items matching specific tags.
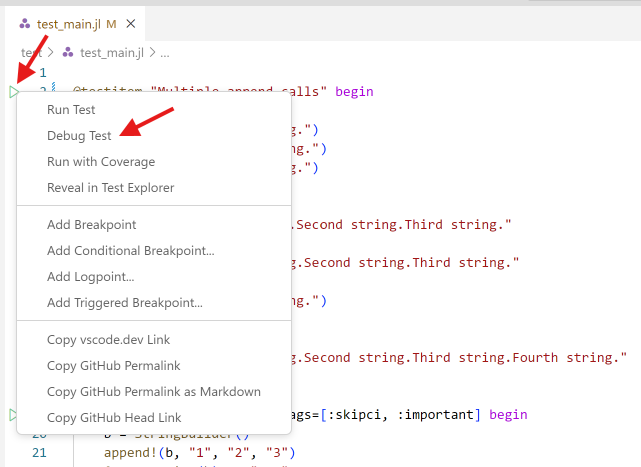
Debugging
Run any test item in the debugger via the Debug Test command. Access it from:
- The Testing activity bar — right-click a test item and select "Debug Test"
- The editor — right-click the inline run button and select "Debug Test"
When debugging, you can set breakpoints in both the @testitem code and the package code being tested. All standard Julia VS Code debugger features are available.
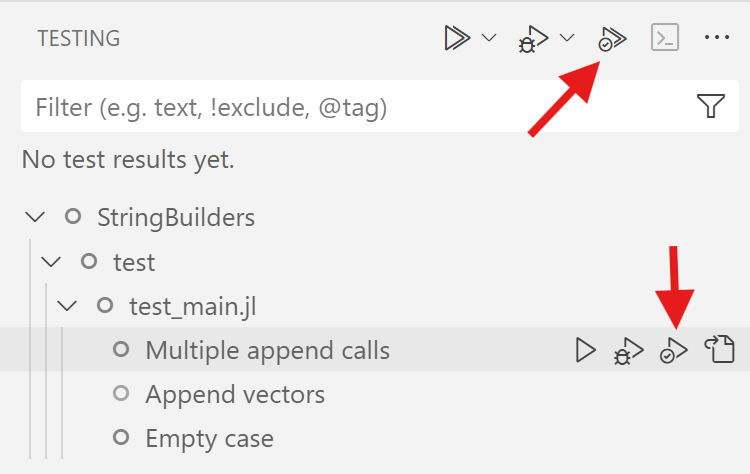
Code Coverage
On Julia 1.11 and newer, you can run test items with code coverage analysis.
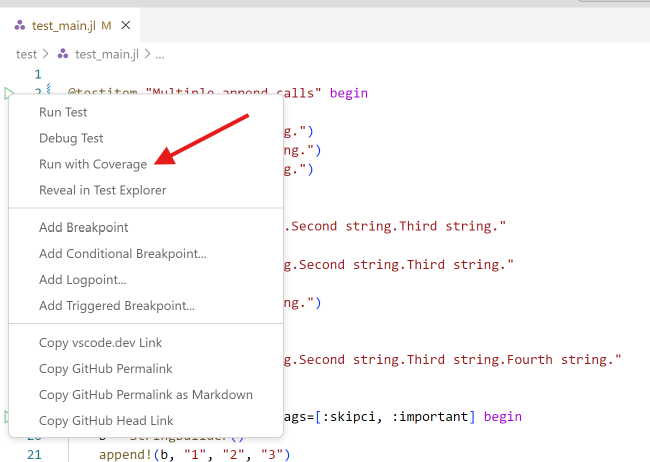
Launch tests with the Run Tests with Coverage command, available in the Testing activity bar:
Or from the editor context menu:
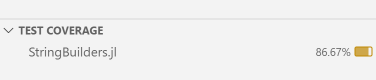
View results in multiple ways:
- Summary view — coverage percentage per file
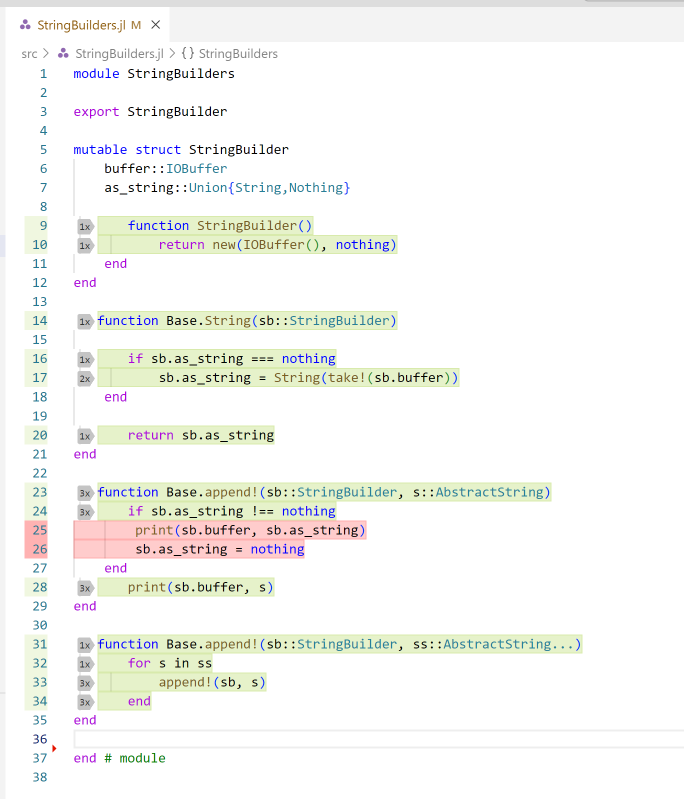
- Inline annotations — line-by-line coverage highlighting in the editor
- Explorer integration — coverage indicators in the file explorer